What Is Liquidity Bias? A Complete Guide for Smart Money Traders
Learn how liquidity bias helps traders identify buy-side and sell-side liquidity, read market structure, and build a directional framework across gold, forex, crypto, and indices.

Live market data
Gold Spot / U.S. Dollar
XAUUSD · Massive · C:XAUUSD
4,284.26 USD
-0.29 (-0.01%)
Previous
4,284.55
Open
4,284.26
High
4,284.26
Low
4,284.26
Volume
1
Updated 27/09/2026, 05:16:46. Market data is informational and may be delayed.
Key takeaways
- What Is Liquidity Bias? A Complete Guide for Smart Money Traders: Most traders spend hours searching for the perfect indicator, yet many overlook one of the most important concepts behind market movement: liquidity.
- Understanding Buy-Side Liquidity: Example of price sweeping buy-side liquidity above equal highs before reversing lower.
- Interpreting The Gold Chart: Looking at the gold example, a Smart Money trader might think through the market like this:
- Key Takeaways: Liquidity is not a trading signal by itself, but it provides valuable context for decision-making.
What Is Liquidity Bias? A Complete Guide for Smart Money Traders
Most traders spend hours searching for the perfect indicator, yet many overlook one of the most important concepts behind market movement: liquidity.
Professional traders are often less concerned with whether a market is bullish or bearish and more interested in where liquidity is resting. This is where liquidity bias becomes a powerful framework. Instead of trying to predict every market move, liquidity bias helps traders identify the side of the market that is most likely to be targeted next.
Whether you trade gold, forex, crypto, or indices, understanding liquidity bias can help you align your analysis with market structure and institutional order flow.
What Is Liquidity Bias?
Liquidity bias is a directional expectation based on the location of untapped liquidity.
Simply put, traders look for areas where resting orders are concentrated and then determine which liquidity pool appears most attractive from the current price position.
The goal is not to predict the future with certainty.
The goal is to identify the side of the market that is most likely to be targeted next.
If a large amount of liquidity exists above price, traders may develop a bullish liquidity bias.
If a large amount of liquidity exists below price, traders may develop a bearish liquidity bias.
Why Liquidity Matters
Financial markets require liquidity to operate efficiently.
Large institutions cannot simply enter or exit massive positions whenever they want. They need sufficient buy and sell orders to facilitate those transactions.
As a result, price frequently gravitates toward areas where orders naturally accumulate.
These areas often include:
Previous highs
Previous lows
Equal highs
Equal lows
Range boundaries
Major swing points
Psychological price levels
Liquidity becomes the fuel that allows larger market participants to transact.
Understanding Buy-Side Liquidity
Buy-side liquidity is typically located above recent highs.
Examples include:
Previous daily highs
Swing highs
Equal highs
Range highs
Many traders place stop losses above these levels when holding short positions.
Breakout traders also place buy stop orders above obvious resistance.
When price trades through those areas, that liquidity becomes available to the market.
Equal highs
Buy-side liquidity
Liquidity sweep
Market reversal
Example of price sweeping buy-side liquidity above equal highs before reversing lower.
Understanding Sell-Side Liquidity
Sell-side liquidity is typically located below recent lows.
Examples include:
Previous daily lows
Swing lows
Equal lows
Range lows
Long traders often place stop losses beneath these levels.
When price moves below support, those stops become liquidity.
Equal lows
Sell-side liquidity
Liquidity sweep
Bullish reaction
Example of price collecting sell-side liquidity below equal lows before moving higher.
How Traders Develop a Liquidity Bias
Liquidity bias is built by comparing uncollected liquidity on both sides of the market.
For example:
Imagine a market recently swept all buy-side liquidity above previous highs.
At the same time, a large pool of sell-side liquidity remains untouched below recent lows.
In this situation, many Smart Money traders would develop a bearish liquidity bias because the largest remaining objective sits below current price.
The opposite is also true.
If sell-side liquidity has already been cleared while significant liquidity remains above price, traders may adopt a bullish liquidity bias.
Real Gold Example: Building a Liquidity Bias
Gold provides an excellent example of how liquidity bias works in practice.
During September, gold traded inside a broad range while repeatedly moving between areas of buy-side and sell-side liquidity.
In the chart below, price first moved into buy-side liquidity resting above previous highs and entered a bearish Order Block near the top of the range.
The reaction was immediate.
Instead of continuing higher, gold rejected strongly and returned toward the middle of the range.
This changed the liquidity picture significantly.
The market had already collected a substantial amount of buy-side liquidity, while a large pool of sell-side liquidity remained below the range.
Gold liquidity bias chart
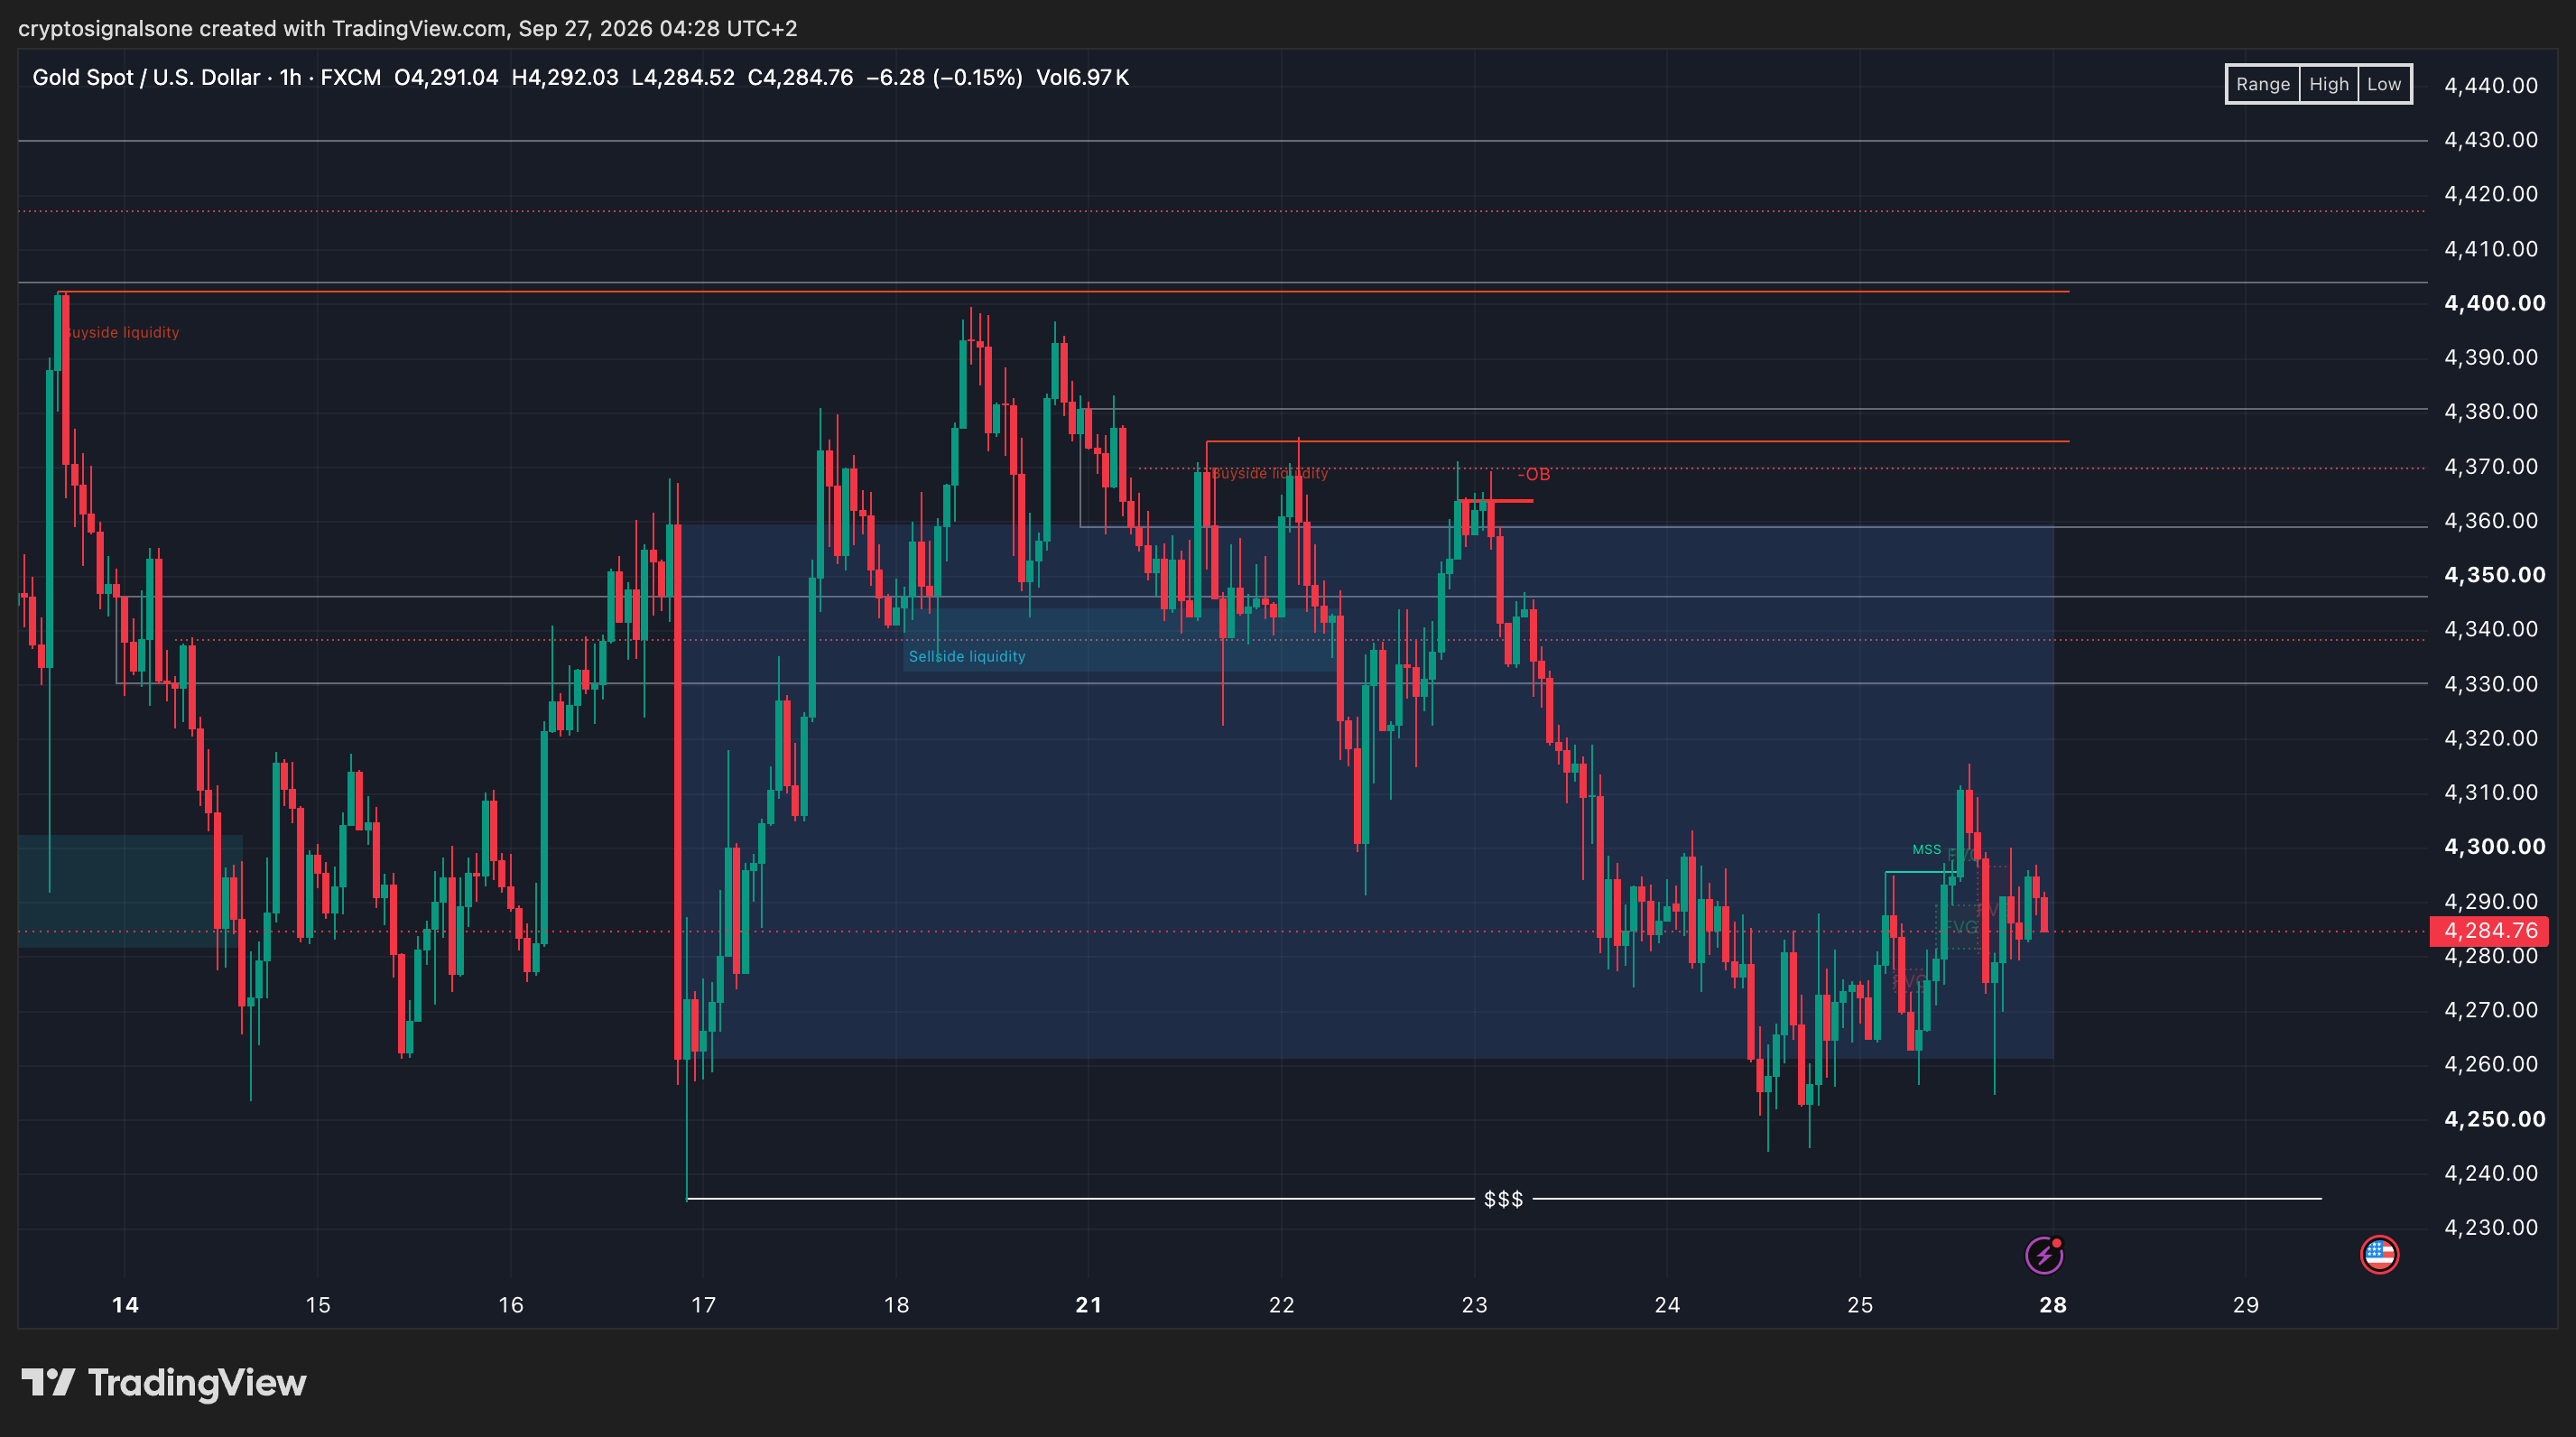
Buy-side liquidity above the highs
Bearish Order Block
Rejection from premium pricing
Current price location
Sell-side liquidity below the range
Fair Value Gap
Market Structure Shift
Gold rejecting from buy-side liquidity before rotating back toward a major pool of sell-side liquidity.
Interpreting The Gold Chart
Looking at the gold example, a Smart Money trader might think through the market like this:
Buy-side liquidity has already been swept.
The bearish Order Block produced a reaction.
Price failed to maintain acceptance above resistance.
Significant sell-side liquidity remains untouched.
The strongest liquidity draw now appears below price.
That does not guarantee a bearish outcome.
However, it creates a bearish liquidity bias because the next major liquidity objective remains beneath the market.
This is a perfect example of using liquidity as context rather than as a trading signal.
Common Liquidity Bias Mistakes
Many traders misunderstand liquidity concepts and end up forcing trades.
Assuming Liquidity Must Be Taken Immediately
Liquidity often acts as a magnet, but markets can spend days or weeks building positions before reaching a target.
Ignoring Higher Time Frames
A bullish liquidity setup on the one-hour chart may conflict with a bearish liquidity objective on the daily chart.
Always start from higher time frames.
Trading Every Liquidity Sweep
Not every sweep creates a reversal.
Sometimes liquidity is collected simply to fuel continuation.
Market structure remains critical.
How To Use Liquidity Bias In Your Trading
A simple daily process looks like this:
Mark previous highs and lows.
Identify equal highs and equal lows.
Locate buy-side and sell-side liquidity.
Determine which liquidity has already been collected.
Identify the largest remaining liquidity pool.
Compare liquidity with market structure.
Develop a directional bias.
This approach works across gold, Bitcoin, forex pairs, stock indices, and commodities.
Final Thoughts
Liquidity bias is not a crystal ball.
It is a framework that helps traders understand where the market may be drawn next.
The best traders do not begin their analysis by asking whether a market will go up or down.
They begin by asking a different question:
Where is the liquidity?
Once that answer becomes clear, directional bias often becomes much easier to develop.
Key Takeaways
Liquidity bias is a directional expectation based on uncollected liquidity.
Buy-side liquidity usually rests above highs.
Sell-side liquidity usually rests below lows.
Liquidity bias should be combined with market structure.
The gold example demonstrates how price can reject after sweeping buy-side liquidity and then seek liquidity below the market.
Liquidity is not a trading signal by itself, but it provides valuable context for decision-making.
Crypto Signals One Insight: Markets often move toward the most obvious pool of untouched liquidity. Finding that liquidity before everyone else is one of the most valuable skills a trader can develop.
Want setups like these in real time?
Join the VIP channel for daily crypto & gold signals.

10% Cashback on Trading Fees — Ongoing
Get 10% cashback on eligible trading fees, plus additional daily-task bonuses through BloFin. Join through our partner link and check the current offer terms before trading.
Claim 10% cashbackCompare Crypto Exchanges
Explore our exchange selection and compare platforms, fees, KYC access, and features.
View exchange comparison