
Real power in trading comes from understanding the logic behind price waves — not just reacting to candles.
In trading, especially in technical analysis, recognizing the end of a trend can be a game-changer.
One of the clearest signals that a downtrend is ending is when price breaks the top of the wave that leads to the lowest trough in the trend.
Let’s break that down and understand it using the visual example from the image.
Not a medium member? Read the full article here.
The Logic of Waves in a Downtrend
In a downtrend, price moves in a series of lower highs and lower lows. This wave pattern tells us that sellers are still in control.
Each high and low matters — but only some of them determine whether the trend is continuing or reversing.
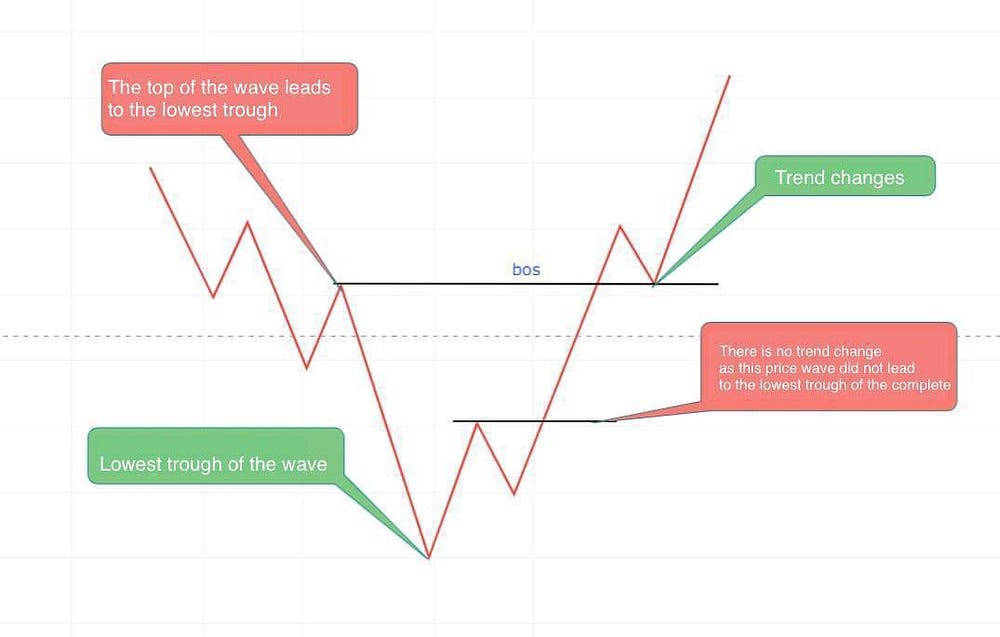
In the image:
- The red waves represent the bearish price action (downtrend).
- The lowest point of the downtrend is identified as the lowest trough of the wave.
- The wave that leads to this lowest trough originates from a specific high — this is a key high, not just any peak.
📌 This high is crucial because it gave birth to the most bearish leg of the trend.
The Break of structure (BOS) is a great strategy to use to minimize you risk and maximize your probsbility to make a winning trade.
Where Does the Trend End?
A downtrend officially ends when the price breaks above the top of the wave that created the lowest trough.
This is marked in the image as the point labeled BoS (Break of Structure).
Why? Because this shows:
- Buyers were strong enough to overcome the most recent and strongest selling wave.
- The market structure has shifted from lower highs to potentially forming higher highs.
This is the earliest valid signal of a potential trend reversal.
“The top of the wave leads to the lowest trough” — once that’s broken, the trend’s integrity is destroyed.
What Doesn’t Count as a Trend Change?
Not every upward movement means a trend reversal.
In the image, there’s a corrective move (small bullish wave) after the lowest trough. However, it fails to break the top of the main wave that caused the lowest low. This is noted in red:
“There is no trend change as this price wave did not lead to the lowest trough of the complete trend.”
This is a common trap for beginner traders — thinking every rally in a downtrend means it’s over.
✅ Key takeaway: Until the price breaks the actual structural high that led to the lowest point, the downtrend is still valid.
When the Trend Truly Changes
As shown on the right side of the image, the market finally breaks above the structural high (BoS), confirming a trend change.
This is where smart traders start to look for:
- Long positions
- Retest entries
- New higher lows forming
This is the moment of opportunity.
Final Thoughts: Structure is King
Understanding wave structure helps filter noise. It keeps you from jumping into false reversals or panic-selling in corrections.
The most reliable trend reversals come not from random candles but from breaks in structure tied to the key highs and lows of the trend.
So remember:
👉 In a downtrend, the reversal only begins when the price breaks the high of the wave that led to the lowest trough. Anything else is just noise.
I hope this article can help you understand the Break of structure (bos) strategy to make you more informed decision when you trade crypto or anything else.
Join my community of crypto enthusiasts and serious traders!
1️⃣ Join our Telegram Channel
️2️⃣ Learn more about our signals and strategies
3️⃣ Join our Private Email list & Get Access to our Trading Signals
4️⃣️ Join our Medium newsletter and be notified when I publish new articles!
Disclaimer: This article is for educational purposes only and should not be considered financial advice. Always conduct your own research before making any trading decisions.
This article does not contain any affiliate links. The page referenced is simply my personal page where you can enter your email if you are genuinely interested in learning more about trading.

![Dogecoin: First Meme Coin ETF on the Horizon – Is It Time to Buy? [Analysis]](https://cryptosignals.one/wp-content/uploads/2025/09/a-vibrant-cartoon-illustration-depicting_stzRCQN_SQOWd_7E3CxL2A_YRk3wyqaS-uLn0m08PiFvg.jpeg)


