Discover how savvy traders capitalize on market movements.
Do you aspire to excel in a specific field? Seek guidance from the industry’s top experts – a trading strategy that applies to trading as well. There’s a remarkable concept and trading strategy known as “Smart Money” that can aid you in this endeavor.
Smart Money Trading strategy refers to entities with substantial capital in the market, equipped with significant assets and funds. Typically, these include central banks, major banks, hedge funds, institutional investors, and other large organizations.
With such vast resources, these entities can significantly impact financial markets and even manipulate asset prices, often exploiting the emotions of smaller participants – a tactic that plays into the market’s psychology.

By understanding the dynamics of “smart money,” you’ll be prepared for any market developments and able to capitalize on market movements to your advantage. This Trading strategy will help you to avoid wrong choice during a specific bump or dump.
The key is that the market offers enough liquidity for individual retail traders to execute their orders directly, thanks to the market’s small order size. This Trading Strategy allows small traders to execute numerous orders quickly, a feat that’s challenging for large entities due to the time it takes to secure such liquidity.
Acquiring this liquidity often requires complex strategies, which “smart money” can identify. Your primary goal is to grasp the behavior of these large entities and align your strategies accordingly.
The core principles of the Smart Money Trading Strategy concept include:
1) Identifying market structures characterized by bullish and bearish trends, as well as consolidation and trading within a sideways range, often referred to as a “range or ‘rent’.”
2) Utilizing multiple timeframes, where the conditions observed on one timeframe influence the direction of trading and identify opportunities for deals on newer ones.
3) Liquidity plays a pivotal role in the market. The primary sources of liquidity are smaller entities that set stop-losses at specific price levels, such as support or resistance, various trend lines, and figure boundaries, which larger entities aim to exploit.
4) Gaps and Imbalance (IMB) represent a situation where the balance between supply and demand is disrupted. “Smart Money” aims to capitalize on these imbalances over time by trading within the range that has been formed.
5) Employing technical patterns of Price Action to identify the optimal entry points for positions.
Before delving into the specifics of the Smart Money Trading Strategy concept, it’s beneficial to explore the history of technical analysis, credited to Richard Wyckoff, its founder.

The Wyckoff method states that the price cycle of a traded instrument consists of 4 stages: Accumulation, Trend Movement, Distribution and Correction.

In a bearish trend, the same dynamics are mirrored. Wyckoff explains the price movement through the “Law of Supply and Demand”: – Demand > supply = price rises. – Demand < supply = prices fall. – Demand = Supply = No significant change in price (low volatility) = Price moves sideways. At its core, Smart Money is a form of technical analysis, focusing on Price Action (candlestick analysis).
The concept of trend and Price Action was first introduced by Charles Dow in the 19th century. In his writings for “Wall Street,” Dow described market actions and the principles of price movement on the stock exchange. Now, let’s delve deeper into the concept of Smart Money (SM):
Smart Money Trading Strategy Benefits
Identifying market structure:
Understanding where the market is headed helps in making informed decisions. It’s crucial to grasp the concept of “structural swing points,” which are significant lows and highs where price reversals occur.
Structural swing points:
A swing high is identified by a candle with the highest maximum, flanked by two candles with lower maximums, indicating a reversal down. Conversely, a swing low is characterized by a candle with the lowest low, with two neighboring candles having higher lows, indicating a reversal up.
Learn more about Technical Analysis in depth Guide here

They are labelled as follows when defining a trend:
- Higher high Higher high (HH);
- Lower high Lower high (LH);
- Higher low Higher low (HL);
- Lower low Lower low (LL).
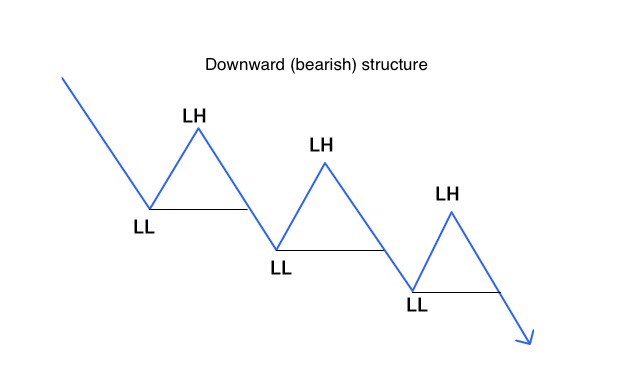
Determining the trend in the market is a fundamental task for any trader. There are 3 main types of market structure: upward (bullish), downward (bearish) and consolidation (sideways movement, rent).
A bullish structure is a series of higher highs and higher lows. Higher Hihg+Higher Low (HH+HL).

Bearish market structure – a series of lower highs and lower lows. Lower Hihg+Lower Low (LH+LL).
Consolidation period – there are no higher highs or lower lows. The price moves in a sideways range. The characteristic feature is a balance between buying and selling.
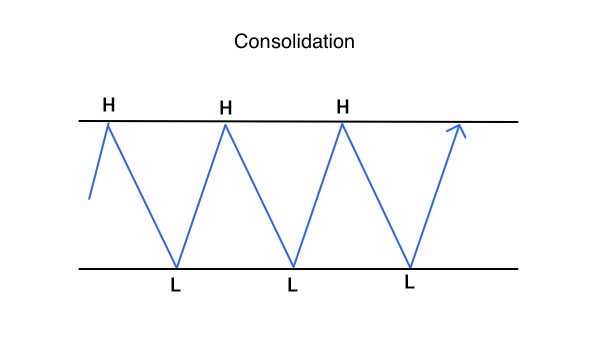
In most cases, such a consolidation period is formed when a major player gains a position or when interest in the asset falls. Due to the sideways movement, the Whale gets the liquidity it needs.
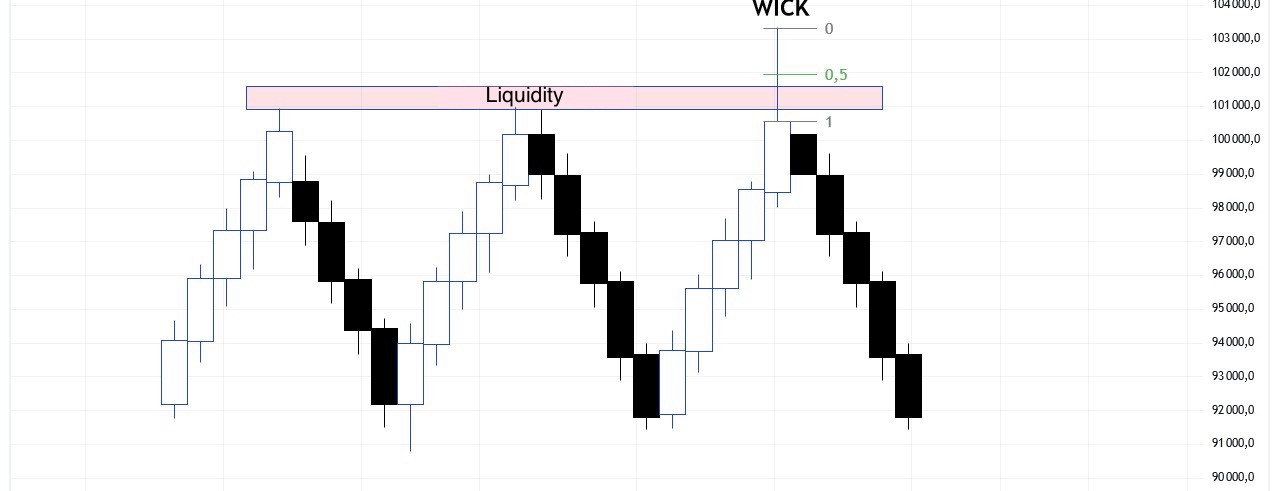
Below we will consider a vivid example of sideways movement using the Fibonacci grid, where 1 and 0 are the highs and lows of the trading range, and 0.5 is the middle of the range.
The main objective of a major player is to capture (collect) liquidity outside the boundaries of the trading range in order to gain a position faster.
Going outside the range is called Deviation (Latin deviatio – deviation).
Deviation formation is very often a signal for price reversal in the opposite direction and return to the boundaries of the sidewall.
After detection of Deviation, entry into a position can be made on a sharp price exit outside the range and the first attempts to return back. Stop-order for the wick formed on the impulse breakdown. Or when the price returns to the boundaries of the sideways corridor.
Structure Breakdown
As we have analysed above, a trend movement can be ascending (updating highs without updating lows) and descending (updating lows without updating highs), but how to understand when a structure break occurs? This is a very important point.
Another important part to the Smart Money Trading Strategy is the Break Of Structure(BOS) is an update of the structure within a trend. Updating the high on an uptrend and updating the low on a downtrend.
Change of Character (CHoCH) – change of trend direction of the market.
The first BoS after CHoCH is called Confirm, and it confirms the change of trend.

Structures are divided into primary and secondary.
- Primary – senior timeframes (4H, 1D, 1W). This is the main trend.
- Secondary – junior timeframes (5min, 15min, 1H). They occur within the primary structures.
Secondary downtrends (corrections of the trend movement) occur within the primary uptrend structure, and vice versa within the primary downtrend structure there will be secondary uptrends.

Optimal trading strategy involves trading in the trend. Without sufficient experience, trading against the trend can be perilous. It’s possible to “catch” corrective movements, but this must be done with extreme caution.
To secure a more advantageous entry point into a position, whether it’s a short or long one, it’s advisable to descend from the higher time frames to the lower ones (1D-4CH-1CH-15min). The structure will generally follow a similar pattern across all time frames. If all conditions are met in each time frame – let’s act!

Liquidity in Smart Money Trading Strategy
Liquidity is undeniably the cornerstone of the Smart Money trading strategy. It acts as the “fuel” that propels the major player to execute the necessary actions and steer the market in their desired direction.
In practice, liquidity for the big player often comes from the stop orders of smaller market participants. These orders are typically placed at the support or resistance levels, around significant figures, or within the shadows of candlesticks, among other places. By executing these stop orders, the large player secures their position to buy or sell, often in a situation that resembles an impulse squeeze.
The largest concentration of orders is found at the significant points of highs and lows, also known as Swing Highs and Swing Lows, which we previously discussed. These are the liquidity pools that the major player seeks out.
When there are equal highs and lows (Double Bottom/Top), the stop orders are filled (liquidity collection) by updating the previous Swing High and Swing Low with the shadow of the candle, creating an impulse squeeze.
In the Smart Money concept, this phenomenon is referred to as SFP (Swing Failure Pattern).
The most common variant of using SFP in trading: opening a position after closing the SFP candle, the stop is placed behind its shadow.
In a sideways movement (accumulation/consolidation) or trending (whether bullish or bearish trend), the shadow of the next SWING candle that breaks through the liquidity zone is called WICK.
Entry into the position in this case will be at 0.5 Fibo at the Wick candle wick with a short stop behind it. The Risk/Profit ratio in this case will be as favourable as possible and the position will be practically safe.
Gaps and Imbalance (Imbalance)
Imbalance (IMB) – is formed due to imbalance between Buy and Sell orders.
On the chart it is a long impulse candle, the body of which “tears” the shadows of the neighbouring two (left and right). If the shadows of the side candles intersect along the length of the impulse candle body, this is not considered an imbalance.
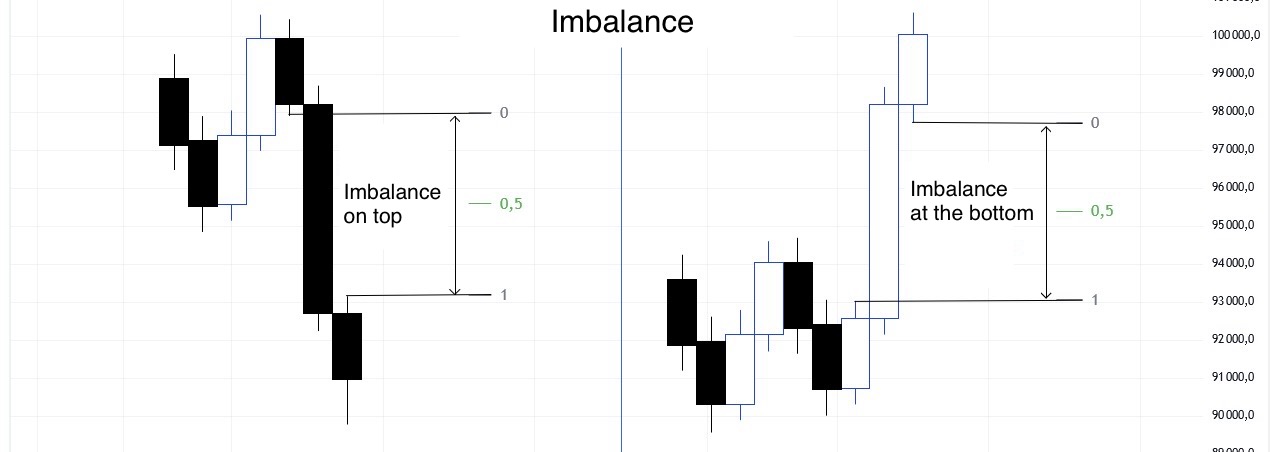
In order to restore balance in the market, a Large player will try to completely close this “hole” (imbalance zone). Imbalance is a kind of a magnet for the price. Analogy with CME gap. Entry is also at reaching 0.5 Fibo (overlapping half of imbalance).
Gap on the Chicago Exchange
At the Chicago Mercantile Exchange (CME Group), trading takes place from Monday to Friday. Bitcoin Futures are traded here. The exchange “rests” on weekends, resuming trading on Monday of the following week.
Due to the fact that classic crypto exchanges (Binance, Coinbase, Bybit, KuCoin, OKX, etc.) trade without weekends, during the weekend trading on them, the BTC exchange rate may change, and then trading on Monday on CME will open with a Gap.
Gap is a price gap on the price chart (in our case, between the closing price on Friday and the price at the time of opening on Monday).
Such “holes” in the future act as a magnet for the price, and in most cases they try to close them over time.
In practice, the smaller the gap, the faster it overlaps.
If on Saturday, during active trading on classic crypto exchanges, the BTC price moves away from the closing price on CME on Friday (above or below). Then, to prevent the formation of a new gap on Monday, the price will tend to return to the starting point by the end of Sunday.
In practice, gaps occur quite often, but in 80-90% of cases they are completely overlapped sooner or later.
Orderblock (OB) – Orderblock.
Orderblock (OB) is a place where a large volume was traded by a big player. Here the key liquidity manipulation is carried out, due to which the whale fills the desired position. For this purpose, he may simultaneously open a short-term losing position on purpose (to show a false movement). In the future, Orderblocks act as a support/resistance and a kind of magnet to which the price will seek, so that the big player will come out of a losing position to BU or even plus.
There are 2 types of Orderblock:
Bearish Orderblock – the highest rising candle with the same function.
Bullish Orderblock – the lowest descending candle that removes liquidity.
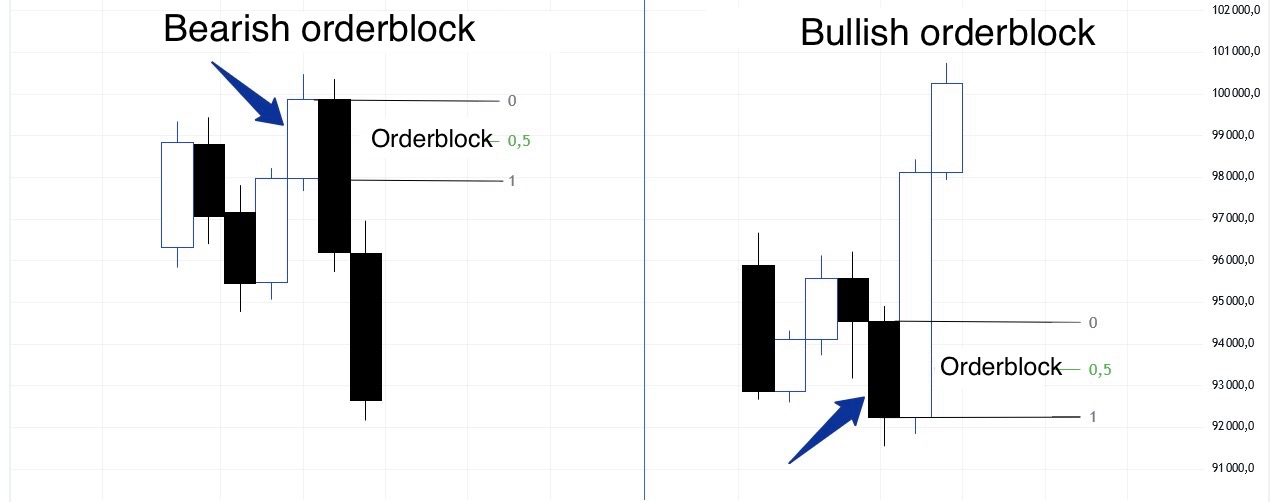
Absorption of the candle that removes liquidity confirms the orderblock.
Optimal entry will be on retest of the orderblock or also 0.5 Fibo of the orderblock candle body with a stop behind the candle’s shadow. For more efficient use, you should choose an OB below which there is no major imbalance or a significant liquidity zone.
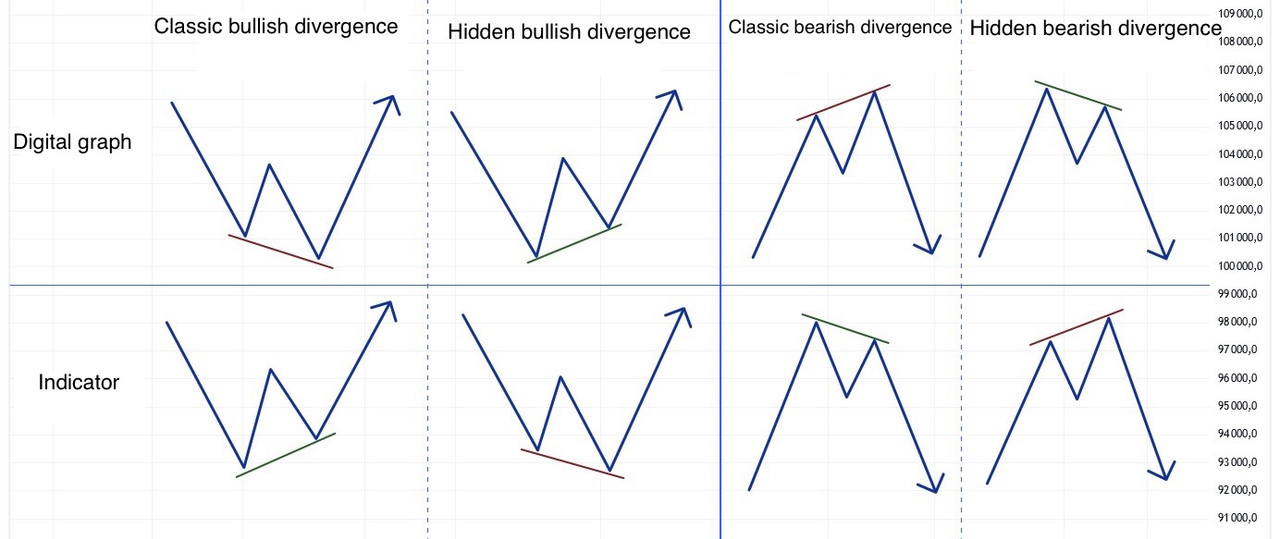
Divergences
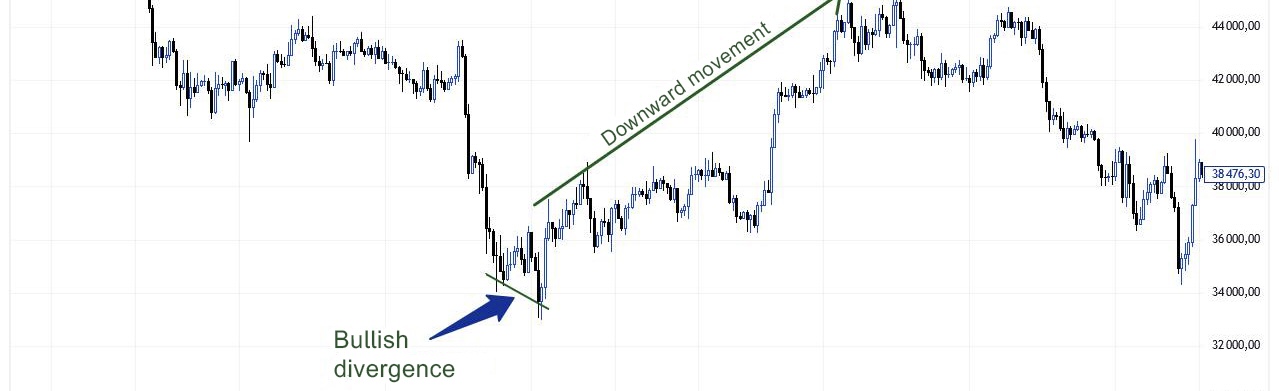
Divergence (from Latin Divergo – “to diverge”, English divergence – “divergence”) is a phenomenon when the price movement direction diverges from the indicator movement direction. It is a reversal signal.
Divergences can be Bullish and Bearish. Also divergence can be Classic and Hidden.
How to detect divergence?
To detect divergence, one of the classical indicators (such as RSI, Stochastic, MACD, etc.) is usually taken as a pair to the price chart.
→Bull divergence: the lows are declining on the price chart, while the lows are rising on the indicator. It indicates weakness of the seller and is a signal for an upward reversal ↑.
In case of hidden divergence on the chart, everything looks the other way round.
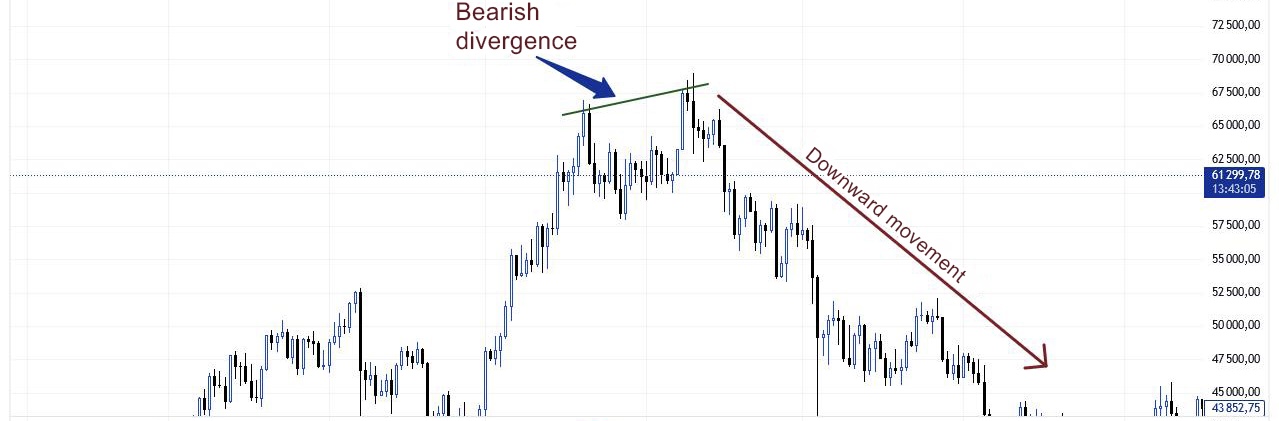
→ Bearish divergence: the highs are rising on the price chart, while the highs are falling on the indicator. It indicates buyer’s weakness and is a signal for a downward reversal ↓.
In case of hidden divergence on the chart, everything looks the other way round.
The older the Timeframe, the stronger the signal will be. On the lower TFs (1-15min), the divergences are broken quite often.
Triple Divergence is a very strong reversal set-up.
Volume Analysis, Vertical Volumes
Volumes reflect the actual interest of market participants. It is an indicator of purchases and sales of an asset for a certain period of time (per traded candle on a particular timeframe, be it 1min/5min/15min/1h/4h/1d, etc.). Volumes help to determine the strength of the trend, as well as to identify its fading and imminent change. They show a deeper picture of the market and are an additional factor in making trading decisions.
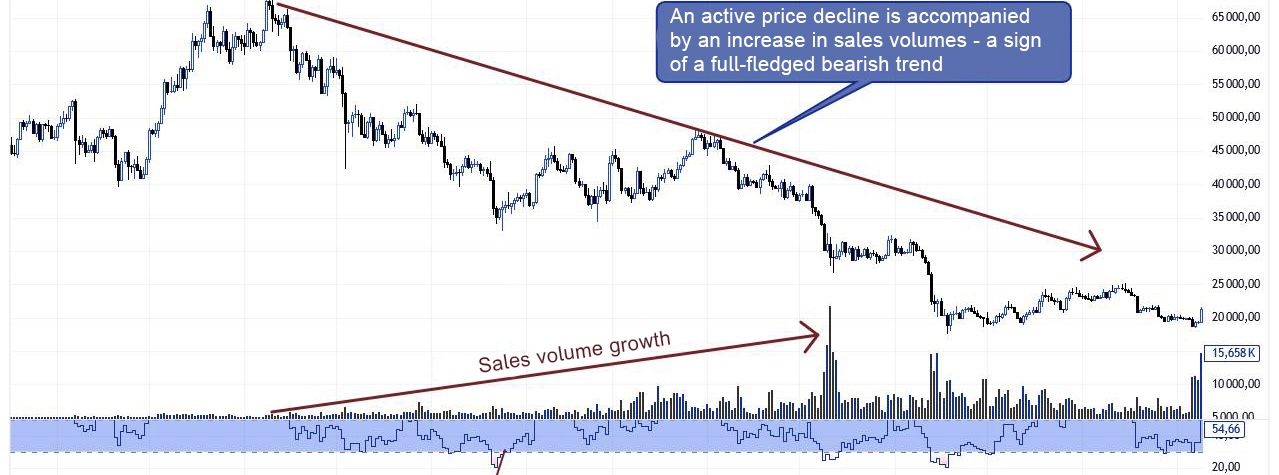
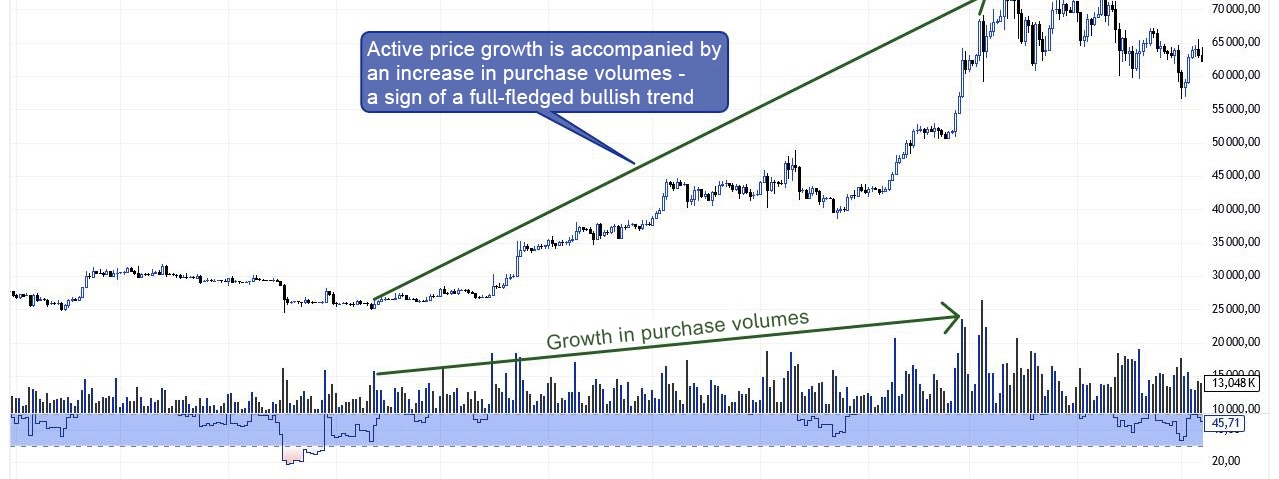
The growth of volumes means the strength of the trend, and the decrease means the weakness of the trend:
In a bullish trend, buying volumes increase, and in a bearish trend, selling volumes increase, respectively.
A rising price in a bullish trend with declining buying volume may signal a near-term reversal to the downside, while a falling price with declining selling volume may signal a near-term reversal to the upside.
Three Drives Pattern
An analogue of the classic “3 Drives” TA Pattern, which we have already studied in the previous course.
The Three Drives Pattern (TDP) is a reversal pattern characterised by a series of higher highs or lower lows. The pattern is often based on a parallel channel or on a “wedge” pattern by updating previous Swing candles.
The pattern is usually formed at a support/resistance zone.
Bullish Three Drives Pattern – a series of lower lows.
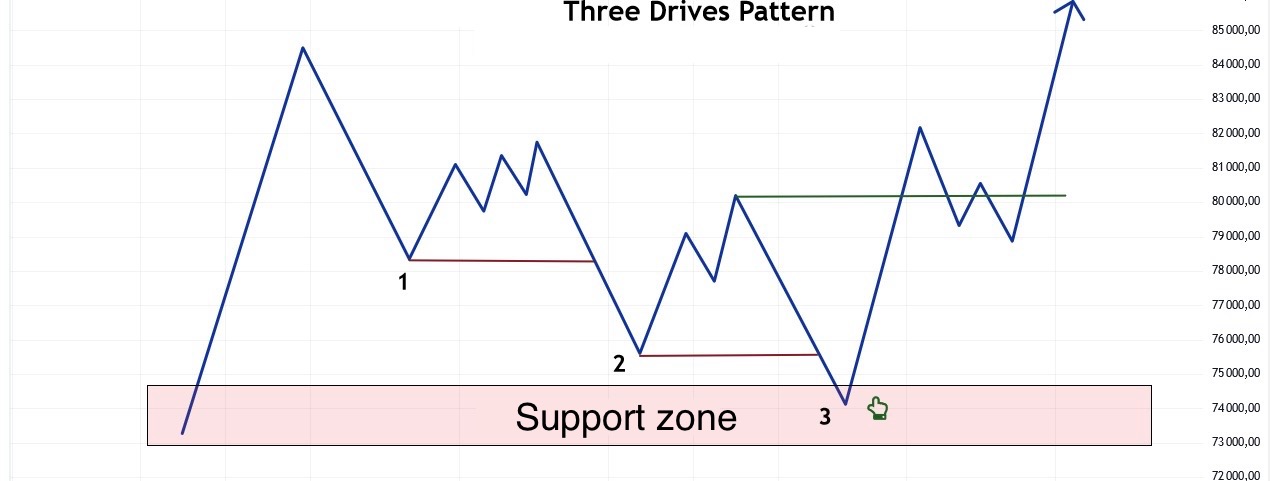
The position will be entered when the price enters the support zone (Support) or after the formation of the third minimum. Stop order is placed below the support zone.
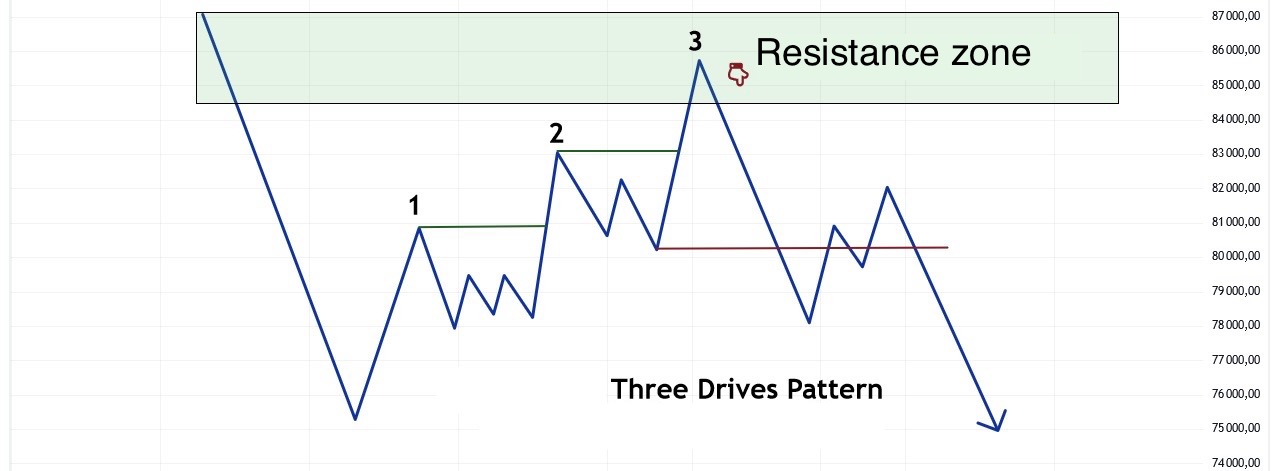
Bearish Three Drives Pattern – a series of higher highs.
Trading sessions – what and when?
The bulk of market activity takes place during the Asian, European (London) and American (New York) trading sessions.
Trading sessions – what and when?
The bulk of market activity takes place during the Asian, European (London) and American (New York) trading sessions.
There are 3 market cycles within a day: Accumulation (accumulation), Manipulation (sharp manipulative movement to capture liquidity and collect stops), Distribution (position distribution).
Usually Accumulation falls on the Asian session, Manipulation on the European (London) session, Distribution on the American (New York) session.
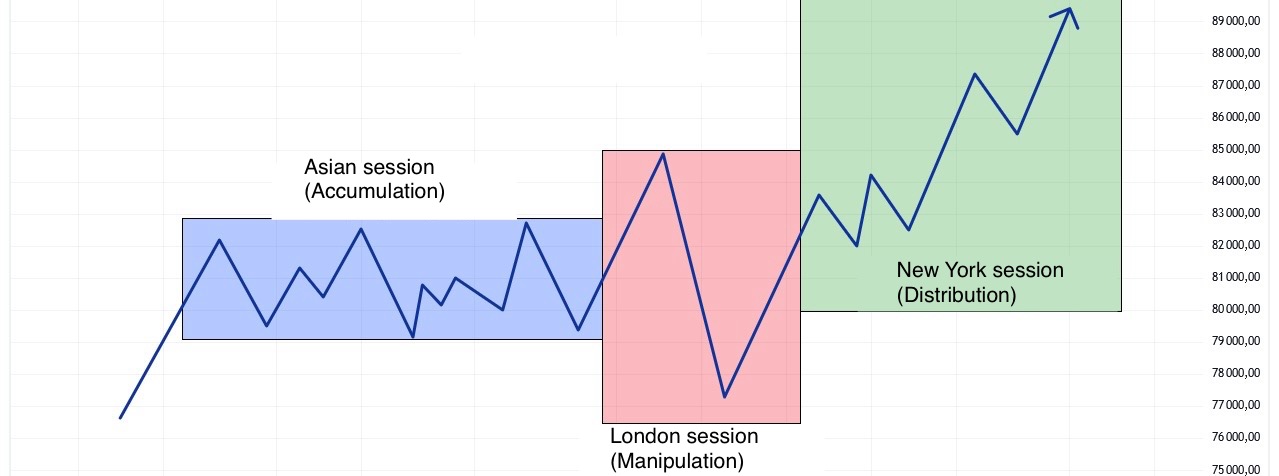
The same pattern will be in a bearish (downtrend).
Important indices
Fear and Greed Index
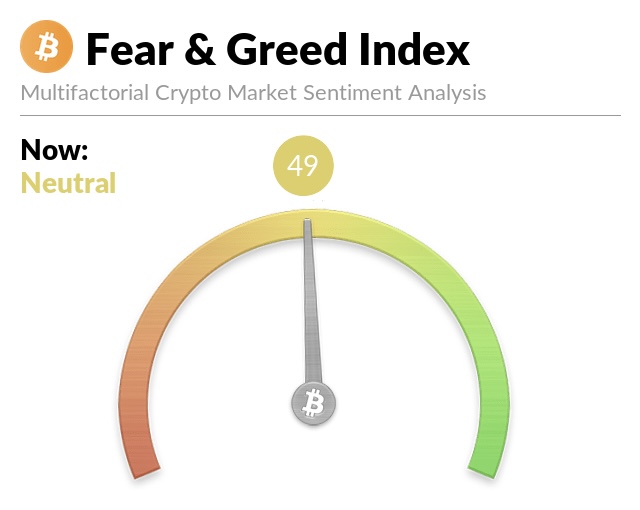
This is an indicator of the change in the Fear and Greed Index over time, where a value of 0 means “Extreme Fear” and a value of 100 means “Extreme Greed”.
Fear is an additional buy signal.
Greed is an additional signal to sell.
“Buy when everyone is afraid and sell when everyone is greedy.”
“Fear in the market is our friend. Critical Fear in the market is our best friend.”
Yes, the cryptocurrency market is developing extremely fast and has already become something habitual for many users, but somehow it is not yet ready for full independence. Crypto is heavily dependent on the classic stock market (represented by the S&P500 index) and the Dollar Index (DXY).
→ The S&P500 is a stock index whose basket includes the shares of 500 selected publicly traded companies with the largest capitalisation traded on US stock exchanges. Direct correlation with BTC and the market in general crypto.
Usually a rise in the S&P500 is accompanied by a rise in BTC and a fall in DXY.
→ DXY is an index showing the ratio of the US dollar to six other major currencies: euro, yen, pound sterling, Canadian dollar, Swedish krona and Swiss franc. Negative (inverse) correlation with BTC and the overall cryptocurrency market.
Usually the growth of DXY is accompanied by a fall in BTC and S&P500.
In order to have a clearer picture of what is happening in your head, you should not neglect these important indices. Often the movement of the same DXY helps to understand the situation on the cryptocurrency market.
Conclusion:
The Smart Money concept opens a new perspective on the market and technical analysis in its classical sense. It gives an opportunity to look at what is happening on the chart from a different angle.
This trading strategy helps to identify the actions of a major player and “sheds light” on many manipulations, explaining their nature. With the help of this smart money trading strategy you will learn how to profit from the manipulations of a big player and will be able to trade alongside him and in the future you will join the ranks of the best of the best – I believe in each of you! I wish you all good luck and huge profits!
For those looking to deepen their knowledge of technical analysis and chart patterns, don’t miss out on our detailed guide here. If you’re ready to take your trading to the next level, consider joining our VIP Crypto Signals Membership here.
Prefer a more hands-off approach? Contact me directly on Telegram here to discuss a 50% profit-sharing opportunity using our signals for every trade.