Crypto Signals One Ebook

Stop entering late. Start reading the chart before the move.

Chart Patterns: Mastering Chart Pattern Analysis is a practical guide to recognizing 40+ candlestick patterns and understanding what price action may be communicating before you make a rushed decision.

$27 launch price $7 · one-time payment
Secure checkout powered by StripeInstant digital access

Educational content only. Trading involves risk. No pattern can guarantee a profitable outcome.

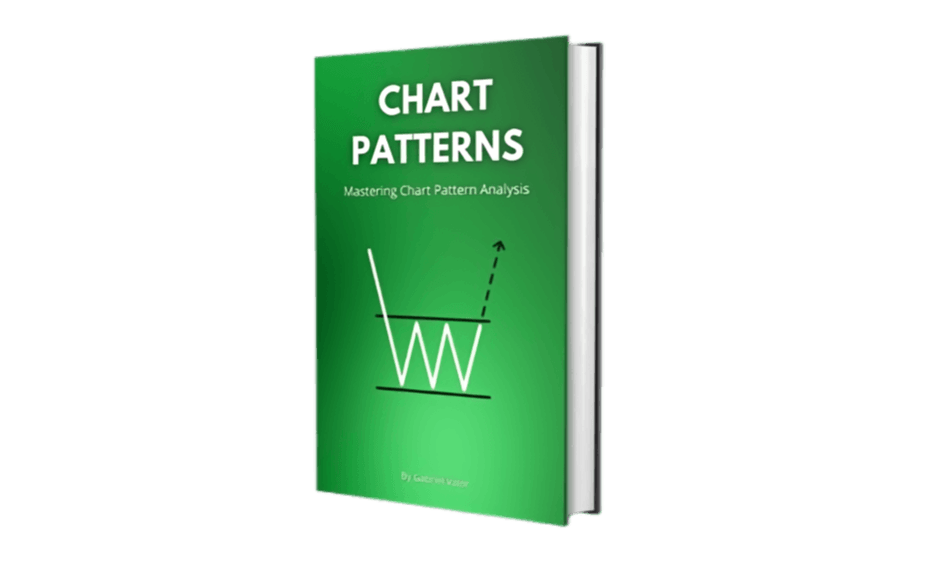
Chart Patterns: Mastering Chart Pattern Analysis ebook cover

Why this matters

The pattern is only the beginning. Context is what makes it useful.

Many traders learn the names of candlesticks but still enter after momentum has already moved. This guide turns pattern recognition into a repeatable chart-reading process.

You will learn what common formations look like, what they can suggest about momentum or hesitation, and why confirmation and market context matter before taking action.

Inside the ebook

A visual pattern library you can return to while studying a chart.

More than 40 well-known candlestick formations, explained in plain language so you can move from memorizing names to reading market behavior.

Doji

What it looks like, what it can signal, and where context matters.

Hammer

What it looks like, what it can signal, and where context matters.

Shooting Star

What it looks like, what it can signal, and where context matters.

Engulfing

What it looks like, what it can signal, and where context matters.

Morning Star

What it looks like, what it can signal, and where context matters.

Evening Star

What it looks like, what it can signal, and where context matters.

Harami

What it looks like, what it can signal, and where context matters.

Pin Bar

What it looks like, what it can signal, and where context matters.

Preview a few pages

See the actual lessons before you decide.

A few excerpts from the ebook show the practical depth: definitions, pattern context, confirmation, and indicators working together.

Chapter 1 · Candlesticks

What is a candlestick?

Each candlestick shows the open, low, high, and close of a market for a particular period. The body shows the open-to-close range; the wick shows the intraperiod high and low.

Excerpt from Chart Patterns
Bullish patterns

Hammer

A hammer has a small body and a long lower wick. It can appear near support after a decline—but the move still needs confirmation before it becomes a trade idea.

Excerpt from Chart Patterns

Chapter 2 · Indicators

RSI and confirmation

The Relative Strength Index measures the speed and change of price movements. Used with price action, it can help frame momentum instead of replacing chart context.

Excerpt from Chart Patterns

Real chart examples

Not just names and diagrams. Learn to read patterns in context.

These examples show the kind of visual analysis inside the ebook: pattern, location, confirmation, and invalidation—not a pattern in isolation.

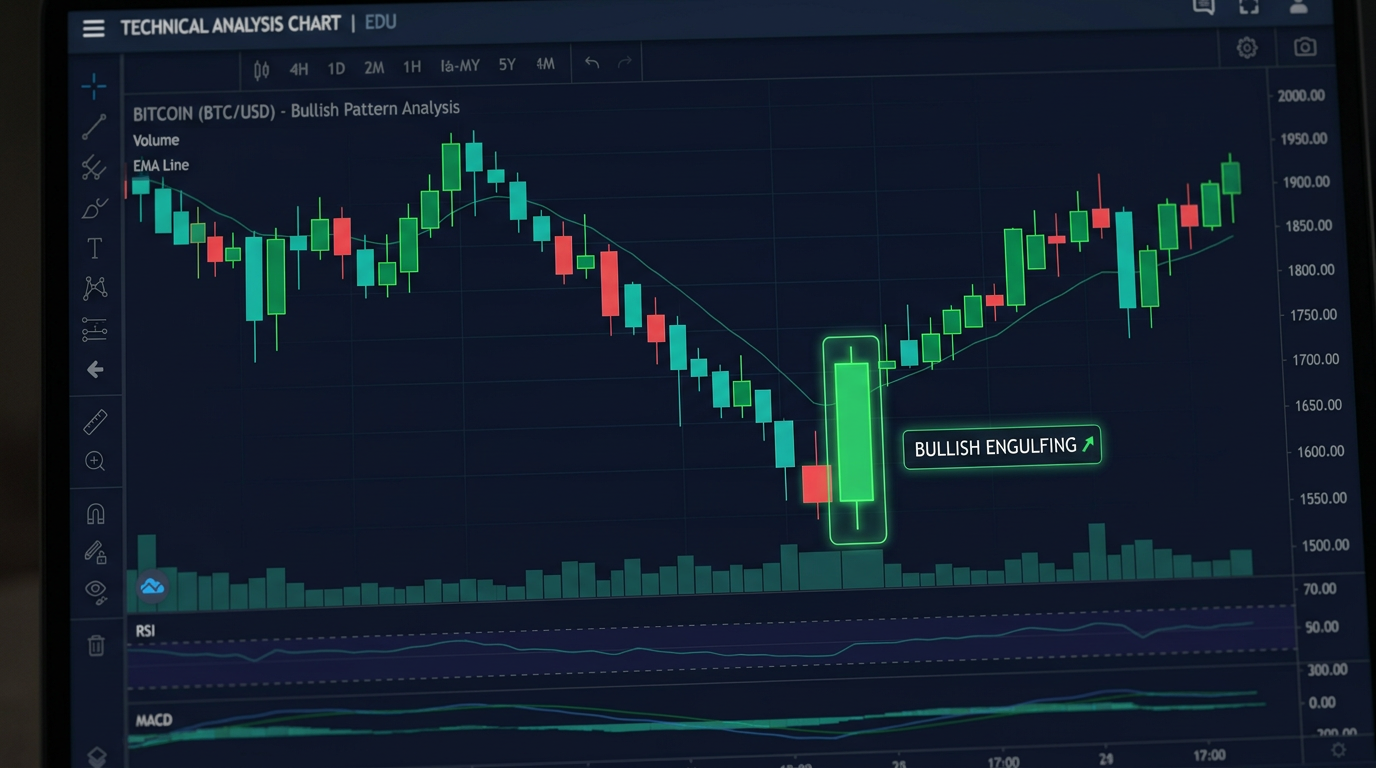
Bullish engulfing candlestick chart example

Bullish engulfing

The second candle fully overtakes the first after pressure down. The ebook explains what confirmation to look for before treating it as a meaningful shift.

Pattern + context + confirmation

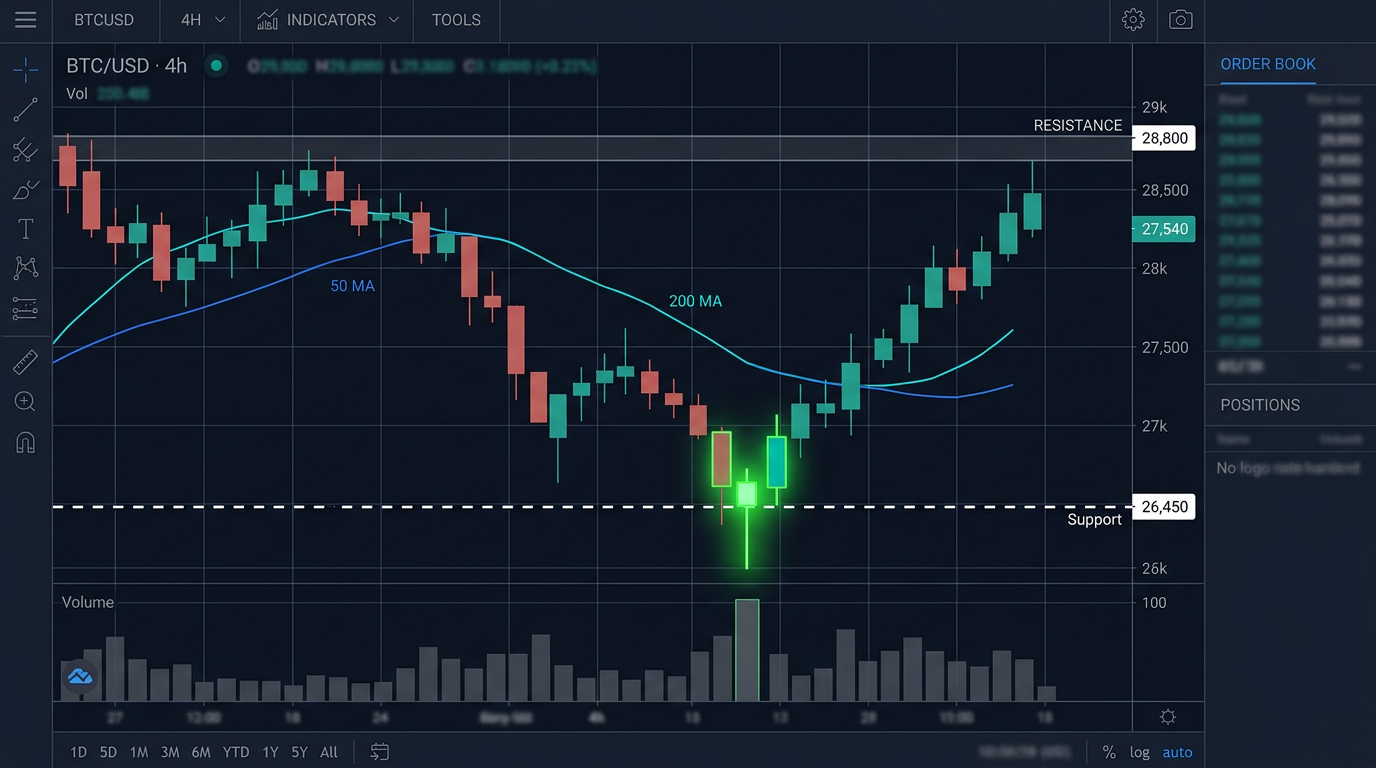
Hammer at support candlestick chart example

Hammer at support

A long lower wick can show rejection, but location matters. Learn why a hammer in the middle of nowhere is not the same setup.

Pattern + context + confirmation

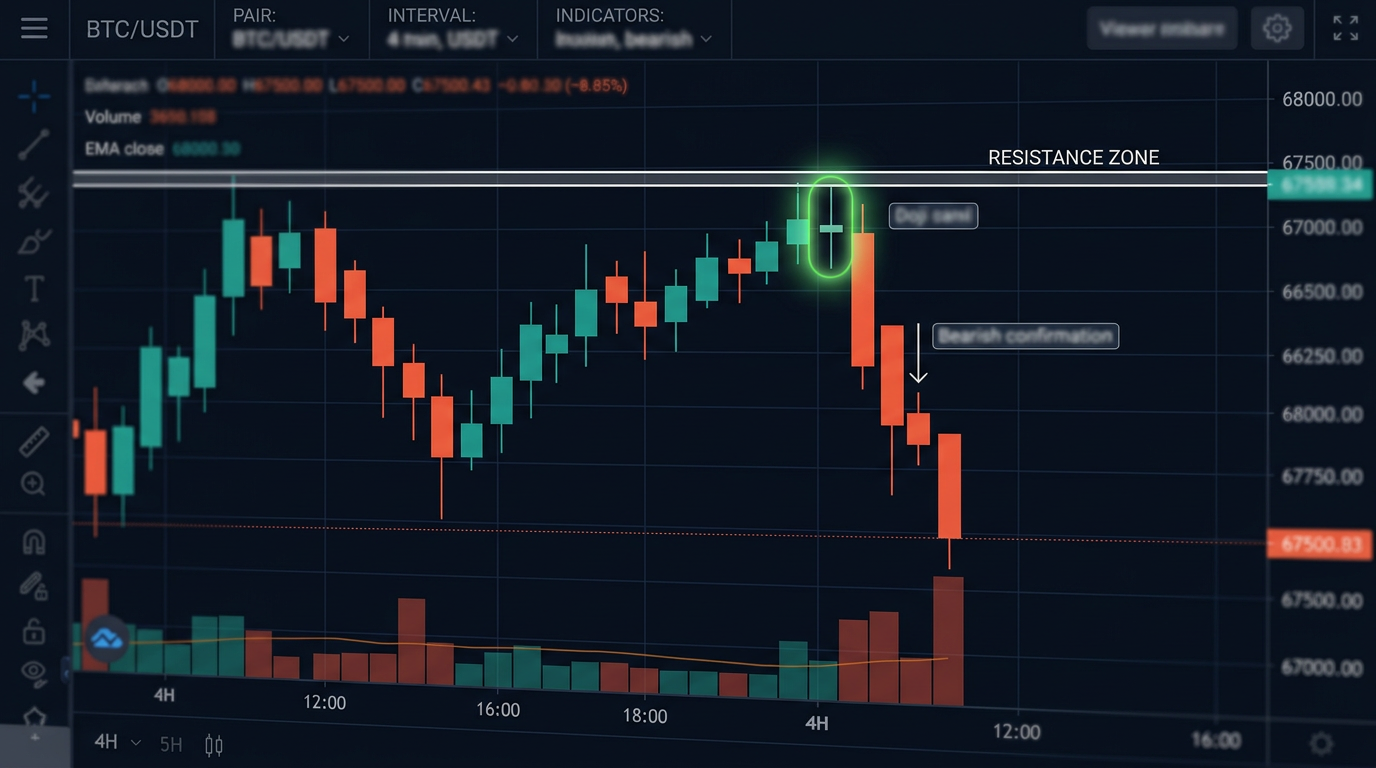
Doji with confirmation candlestick chart example

Doji with confirmation

A doji signals hesitation—not an automatic entry. See how the following candles and nearby levels help frame the decision.

Pattern + context + confirmation

Recognize earlier

Build pattern recognition before the market forces you into a rushed decision.

Filter the noise

Learn why a pattern alone is not enough and what confirmation can add.

Study with structure

Use a repeatable review process instead of relying on instinct at the worst moment.

A transparent approach

Built for education, not unrealistic promises.

Crypto Signals One focuses on clearer analysis and disciplined risk management. This ebook is one educational resource in that process—not a shortcut, signal subscription, or promise of returns.

About the author

Written by Gabriel at Crypto Signals One, based on the practical chart-reading concepts used across the project’s educational content. The goal is simple: make technical analysis easier to study and apply responsibly.

Questions before you start

Chart Patterns FAQ

Is this ebook for beginners?

Yes. It is designed as a practical reference for newer traders and as a quick pattern library for anyone who wants to refresh their technical analysis foundation.

Does the ebook guarantee profitable trades?

No. Candlestick patterns are probabilities, not guarantees. The guide focuses on recognition, context, confirmation, and disciplined decision-making.

What do I receive after payment?

You receive digital access to Chart Patterns: Mastering Chart Pattern Analysis after the one-time checkout is completed.

Is this a trading signals service?

No. This is an educational ebook. It does not provide personalized investment advice or promise specific market outcomes.

Start with the foundation

Learn the language of the candles before you risk another entry.

Get Chart Patterns: Mastering Chart Pattern Analysis for the $7 launch price. One payment, instant digital access.

Secure checkout powered by Stripe · Educational content only · Markets involve risk.

Dany O. joined the Launch Plan recently

Verified purchase

Telegram