
Gold Outlook: How Rates and Dollar Strength Could Shape the Next Move
Gold outlook for September 25, 2026: how real yields, Federal Reserve policy, dollar strength, physical demand, and geopolitical risk could shape the next move.


Live market data
Gold Spot / U.S. Dollar
XAUUSD · Massive · C:XAUUSD
4,284.26 USD
-0.29 (-0.01%)
Previous
4,284.55
Open
4,284.26
High
4,284.26
Low
4,284.26
Volume
1
Updated 27/09/2026, 04:01:48. Market data is informational and may be delayed.
Key takeaways
- Gold Outlook: How Rates and Dollar Strength Could Shape the Next Move: Gold is trading near $4,274 per ounce as of September 27, 2026, with the precious metal caught between support from physical demand and pressure from a stronger U.S. dollar and higher Treasury yields. The next directional move will likely depend less on a single headline and more on how rates, real yields, inflation expectations, and dollar strength interact.
- Bullish scenario: Gold holds above important technical support while real yields ease, the dollar loses momentum, and physical or central-bank demand remains resilient. Under this scenario, dips may attract buyers, although volatility can remain elevated.
- SMC Outlook For The Week Ahead: At the same time, traders should continue monitoring interest rate expectations, Treasury yields, and the U.S. dollar. As long as yields remain firm and dollar strength persists, the macro backdrop is likely to limit bullish momentum and support the case for further liquidity engineering within the current range.
- Is this a price prediction?: No. It is a scenario-based analysis. The outcome depends on incoming data, policy expectations, dollar direction, yields, demand, and risk sentiment.
Gold Outlook: How Rates and Dollar Strength Could Shape the Next Move
Gold is trading near $4,274 per ounce as of September 27, 2026, with the precious metal caught between support from physical demand and pressure from a stronger U.S. dollar and higher Treasury yields. The next directional move will likely depend less on a single headline and more on how rates, real yields, inflation expectations, and dollar strength interact.
Market snapshot: September 27, 2026
Spot gold: near $4,274 per ounce in the latest market snapshot.
Dollar and yields: a firmer U.S. dollar and rising Treasury yields are creating near-term headwinds.
Federal Reserve: the latest policy signal is being read as hawkish, with inflation still a central concern.
Supportive forces: resilient physical demand, particularly from China, geopolitical uncertainty, and concerns around U.S. sovereign debt.
Why rates matter for gold
Gold does not pay interest or dividends, so the opportunity cost of holding it rises when cash and government bonds offer higher real yields. If inflation-adjusted yields continue to climb, investors may prefer income-producing assets and gold can face valuation pressure. If real yields fall, or markets begin pricing a more accommodative Federal Reserve, that headwind can weaken.
The important distinction is between nominal rates and real rates. A high nominal yield can be less restrictive for gold if inflation expectations are also high. Traders should therefore monitor inflation-adjusted yields and the market’s expectations for future policy rather than reacting to the headline rate alone.
Dollar strength is the second key variable
Gold is priced internationally in U.S. dollars. A stronger dollar can make bullion more expensive for non-dollar buyers and often weighs on dollar-denominated commodities. A weaker dollar, by contrast, can support gold by improving affordability abroad and reducing the relative appeal of cash.
For this reason, a sustained dollar rally would be a risk to the bullish gold case, especially if it is accompanied by higher real yields. A dollar reversal could provide an important tailwind, but traders should confirm the move with price action and broader cross-asset signals.
Bullish, neutral, and bearish scenarios
Bullish scenario
Gold holds above important technical support while real yields ease, the dollar loses momentum, and physical or central-bank demand remains resilient. Under this scenario, dips may attract buyers, although volatility can remain elevated.
Neutral scenario
The dollar and Treasury yields remain firm, but geopolitical uncertainty and physical demand prevent a deeper correction. Gold may consolidate in a wide range while markets wait for clearer guidance on inflation and the Federal Reserve path.
Bearish scenario
The dollar strengthens further, real yields rise, and investors reduce exposure to non-yielding assets. A break below major support could accelerate profit-taking and expose gold to a deeper pullback.
Gold Technical Outlook: Weekly Close Keeps Focus on Liquidity
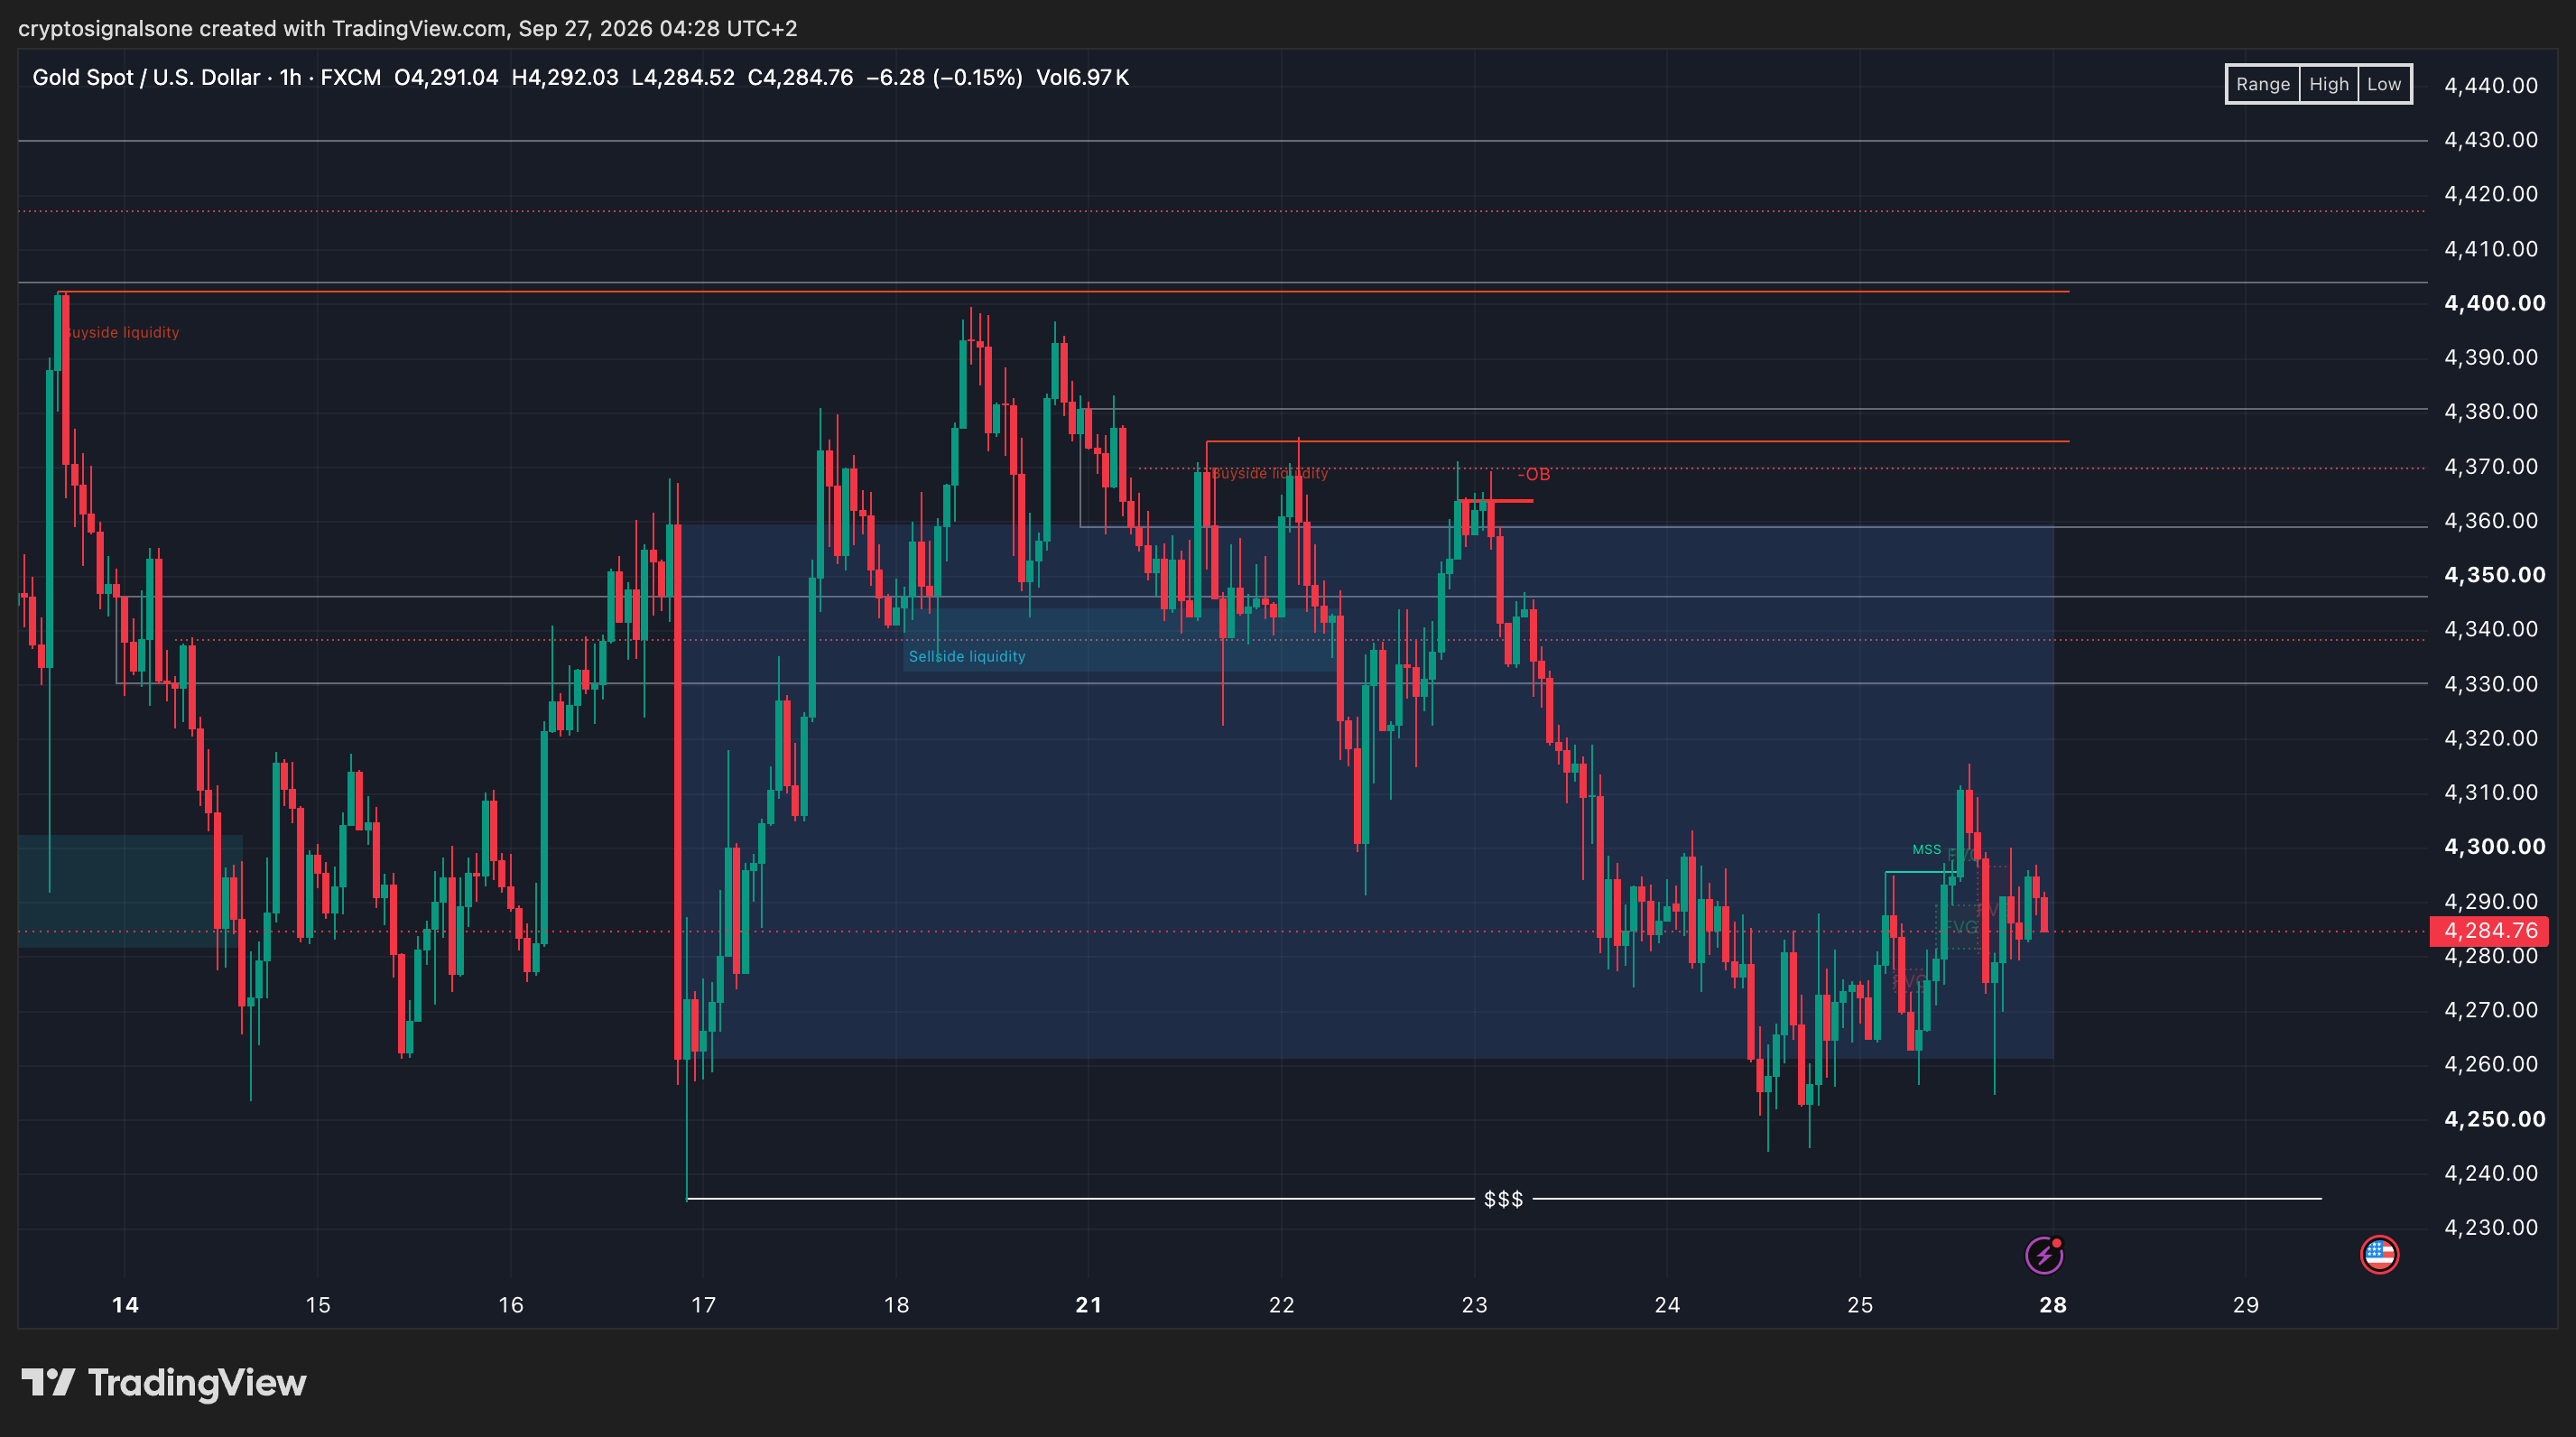
Gold ended the week with a relatively weak close near $4,285, remaining below the key psychological level at $4,300 and well under the bearish Order Block that capped price around $4,365-$4,375. The inability to sustain strength after the recent rally suggests that buy-side liquidity above the range has already been efficiently delivered into, while institutional participation remains cautious amid elevated Treasury yields and continued U.S. dollar resilience.
From a Smart Money Concepts perspective, the most notable development was the rejection from the upper liquidity zone followed by a sustained move lower into the middle of the broader range. Although buyers generated a short-term Market Structure Shift and reacted from a local Fair Value Gap near $4,280, the recovery lacked momentum and failed to produce a meaningful continuation.
This leaves gold trading inside a well-defined liquidity range, with price currently sitting closer to support than resistance.
Key Liquidity Levels
- Buy-side liquidity: $4,365-$4,375
- Major resistance: $4,360
- Psychological resistance: $4,300
- Current price area: $4,285
- Range support: $4,260
- External sell-side liquidity: $4,240
SMC Outlook For The Week Ahead
The weekly close favors a cautious bearish bias while price remains below $4,300. The rejection from buy-side liquidity confirms that sellers are still defending premium pricing, increasing the probability of a deeper move toward uncollected liquidity resting beneath the range.
Unless buyers reclaim and hold above $4,300, gold may continue seeking lower liquidity before a larger directional expansion develops. The sell-side liquidity pool around $4,240 remains the most attractive downside objective from a liquidity perspective.
At the same time, traders should continue monitoring interest rate expectations, Treasury yields, and the U.S. dollar. As long as yields remain firm and dollar strength persists, the macro backdrop is likely to limit bullish momentum and support the case for further liquidity engineering within the current range.
Crypto Signals One Liquidity Bias: Bearish below $4,300, with $4,240 remaining the primary liquidity magnet heading into the new trading week.
What traders should monitor next
U.S. inflation data and inflation expectations
Treasury yields, especially inflation-adjusted real yields
The U.S. Dollar Index and broader dollar momentum
Federal Reserve communication and rate expectations
China physical demand and central-bank buying
Geopolitical developments and changes in sovereign-debt risk perception
Risk management for gold exposure
Gold can be volatile even when its long-term narrative is constructive. Avoid treating a bullish macro thesis as a guaranteed trade. Define invalidation levels, size positions conservatively, account for spread and overnight costs, and avoid leverage unless the liquidation risk is fully understood.
This is market analysis for educational purposes, not personalized financial advice. Prices and macro conditions change quickly; confirm live data before making a trading or investment decision.
Related reading
Sources and data notes
Market snapshot and macro context reviewed September 27, 2026. Key inputs include current spot-gold pricing, Treasury-yield and U.S.-dollar direction, recent Federal Reserve communication, physical demand signals from China, and geopolitical/debt-risk developments. Verify live figures with primary market and central-bank sources before trading.
Frequently asked questions
What is the biggest short-term risk for gold?
A continued rise in the U.S. dollar and real Treasury yields is the clearest near-term headwind because it raises the opportunity cost of holding non-yielding bullion.
Can gold rise when rates are high?
Yes. Strong physical demand, geopolitical risk, inflation expectations, central-bank buying, or concerns about sovereign debt can offset the pressure from higher yields.
Is this a price prediction?
No. It is a scenario-based analysis. The outcome depends on incoming data, policy expectations, dollar direction, yields, demand, and risk sentiment.
Want setups like these in real time?
Join the VIP channel for daily crypto & gold signals.

10% Cashback on Trading Fees — Ongoing
Get 10% cashback on eligible trading fees, plus additional daily-task bonuses through BloFin. Join through our partner link and check the current offer terms before trading.
Claim 10% cashbackCompare Crypto Exchanges
Explore our exchange selection and compare platforms, fees, KYC access, and features.
View exchange comparison